Example: Reading and Analyzing Data from Eurostat
This example shows how to read and analyze data from the Linked Open Data source Eurostat. The corresponding RapidMiner workflow can be downloaded from myExperiment.
In this example, we read a list of countries with their GDP and energy consumption from Eurostat, and examine whether the two are correlated.
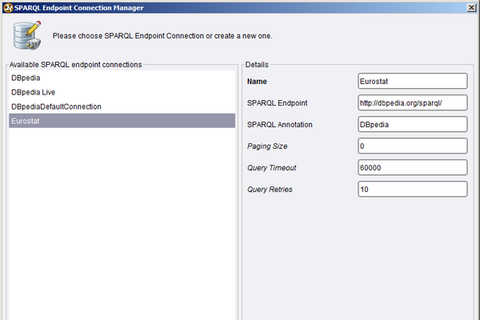
- To access a Linked Open Data source such as Eurostat, a SPARQL Endpoint has to be defined first. This is done by accessing the SPARQL Endpoint configuration dialog, available from the menu “Tools”->“Manage SPARQL Connections”.
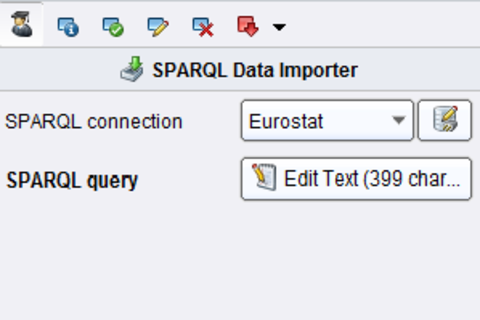
- To read data from the endpoint, we use the SPARQL Data Importer operator. It takes two parameters: the SPARQL endpoint we defined before, and a SPARQL query statement which is used to create the table.
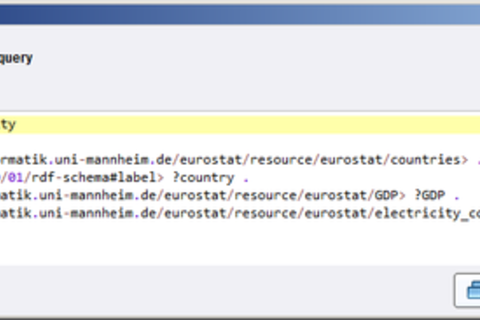
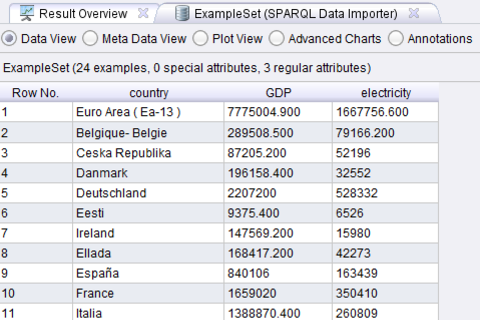
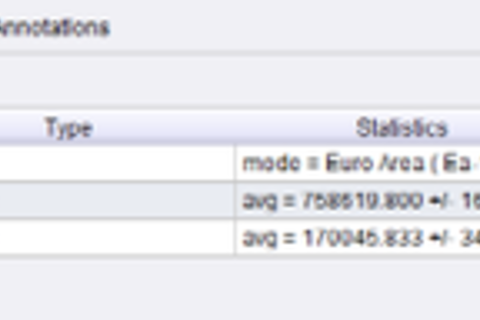
- As the SPARQL statement contains three variables, i.e., country, GDP, and electricity, a table with three columns is generated. The datatypes are assigned automatically, i.e., the country name becomes a text attribute, while GDP and electricity are recognized as numeric, as we can observe in the metadata view.
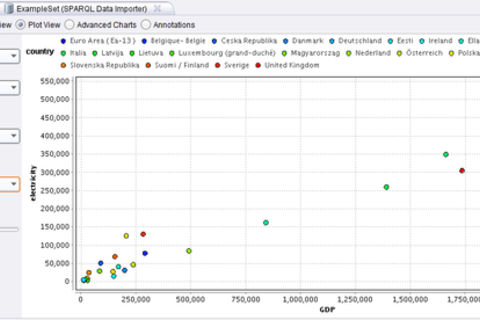
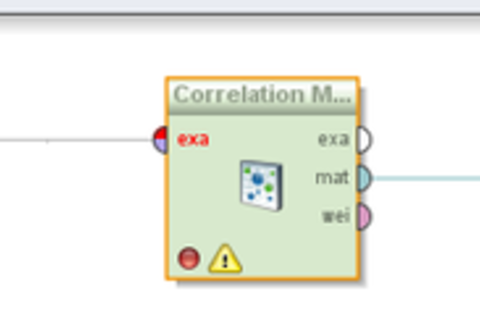
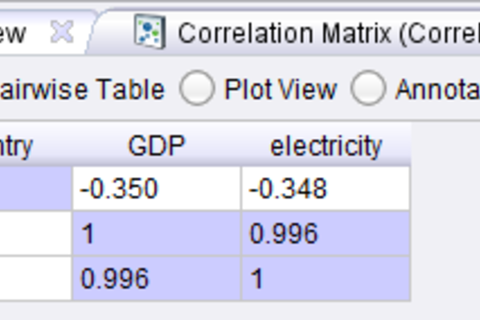
- To analyze the correlation between GDP and electricity, we can use the scatter plot view in RapidMiner to get a first impression. Wiring the output of the SPARQL Data Importer to the Correlation Matrix operator in RapidMiner also allows for a formal computation of the correlation.
- The final results show that there is a strong correlation between the GDP and the energy consumption of European countries.
To wrap up: the RapidMiner Linked Open Data extension can read data from open data sources, such as Eurostat, and make it accessible in RapidMiner for further processing.