Technological innovations in data science and artificial intelligence research have led to increasing task automation in autonomous driving.
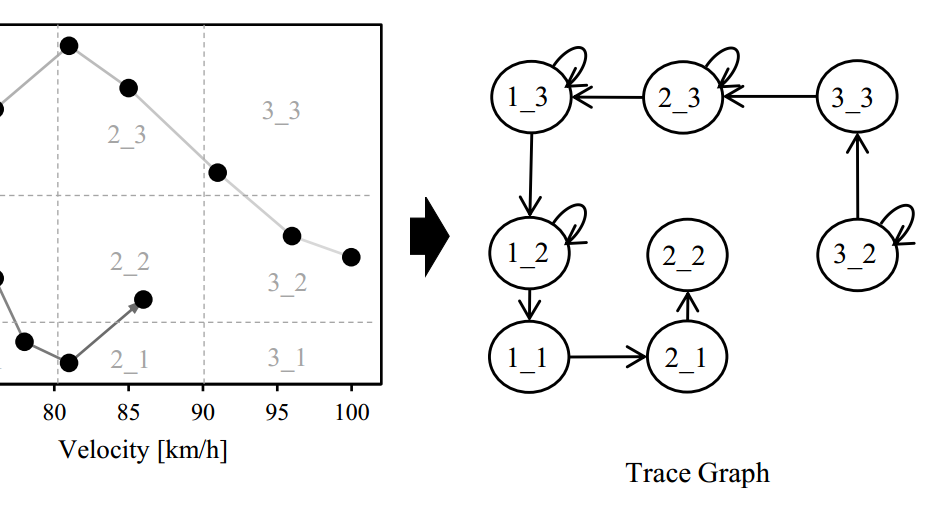
Currently, most test engineering processes in the industry are based on manual test case specification and the accumulation of certain test mile thresholds. This test engineering is very cost- and time-consuming. But especially the test case specification and selection is influenced by human bias. A promising potential approach to overcome those drawbacks is data-driven test case mining based on big data of sensor/actor recordings from real driving situations. The key challenge for data-driven test case mining, is handling the huge amount of data generated by the car sensors related to the open-world context of autonomous driving. This paper presents a novel data-driven approach to quantify events and situations which occur during recorded test drives by transforming multivariate time series data into a condensed, directed graph. This graphical model makes such events and situations comparable and enables the application of established coverage criteria and thus supports statistical statements regarding the coverage of potentially infinite operating environments. To illustrate the benefits of this approach, we conducted a quantitative evaluation in an industrial context in the domain of automated driving, including over 1000 km of field data. The overall results prove that a significant amount of the data characteristics do not get lost during the Graph transformation.
Full Paper
Slides